You can find analytics on your bugs on your Analytics page. This page will show you amalgamated data about your app and reports such as charts. These reports break down bug reports by app version or tags within a specified time frame.
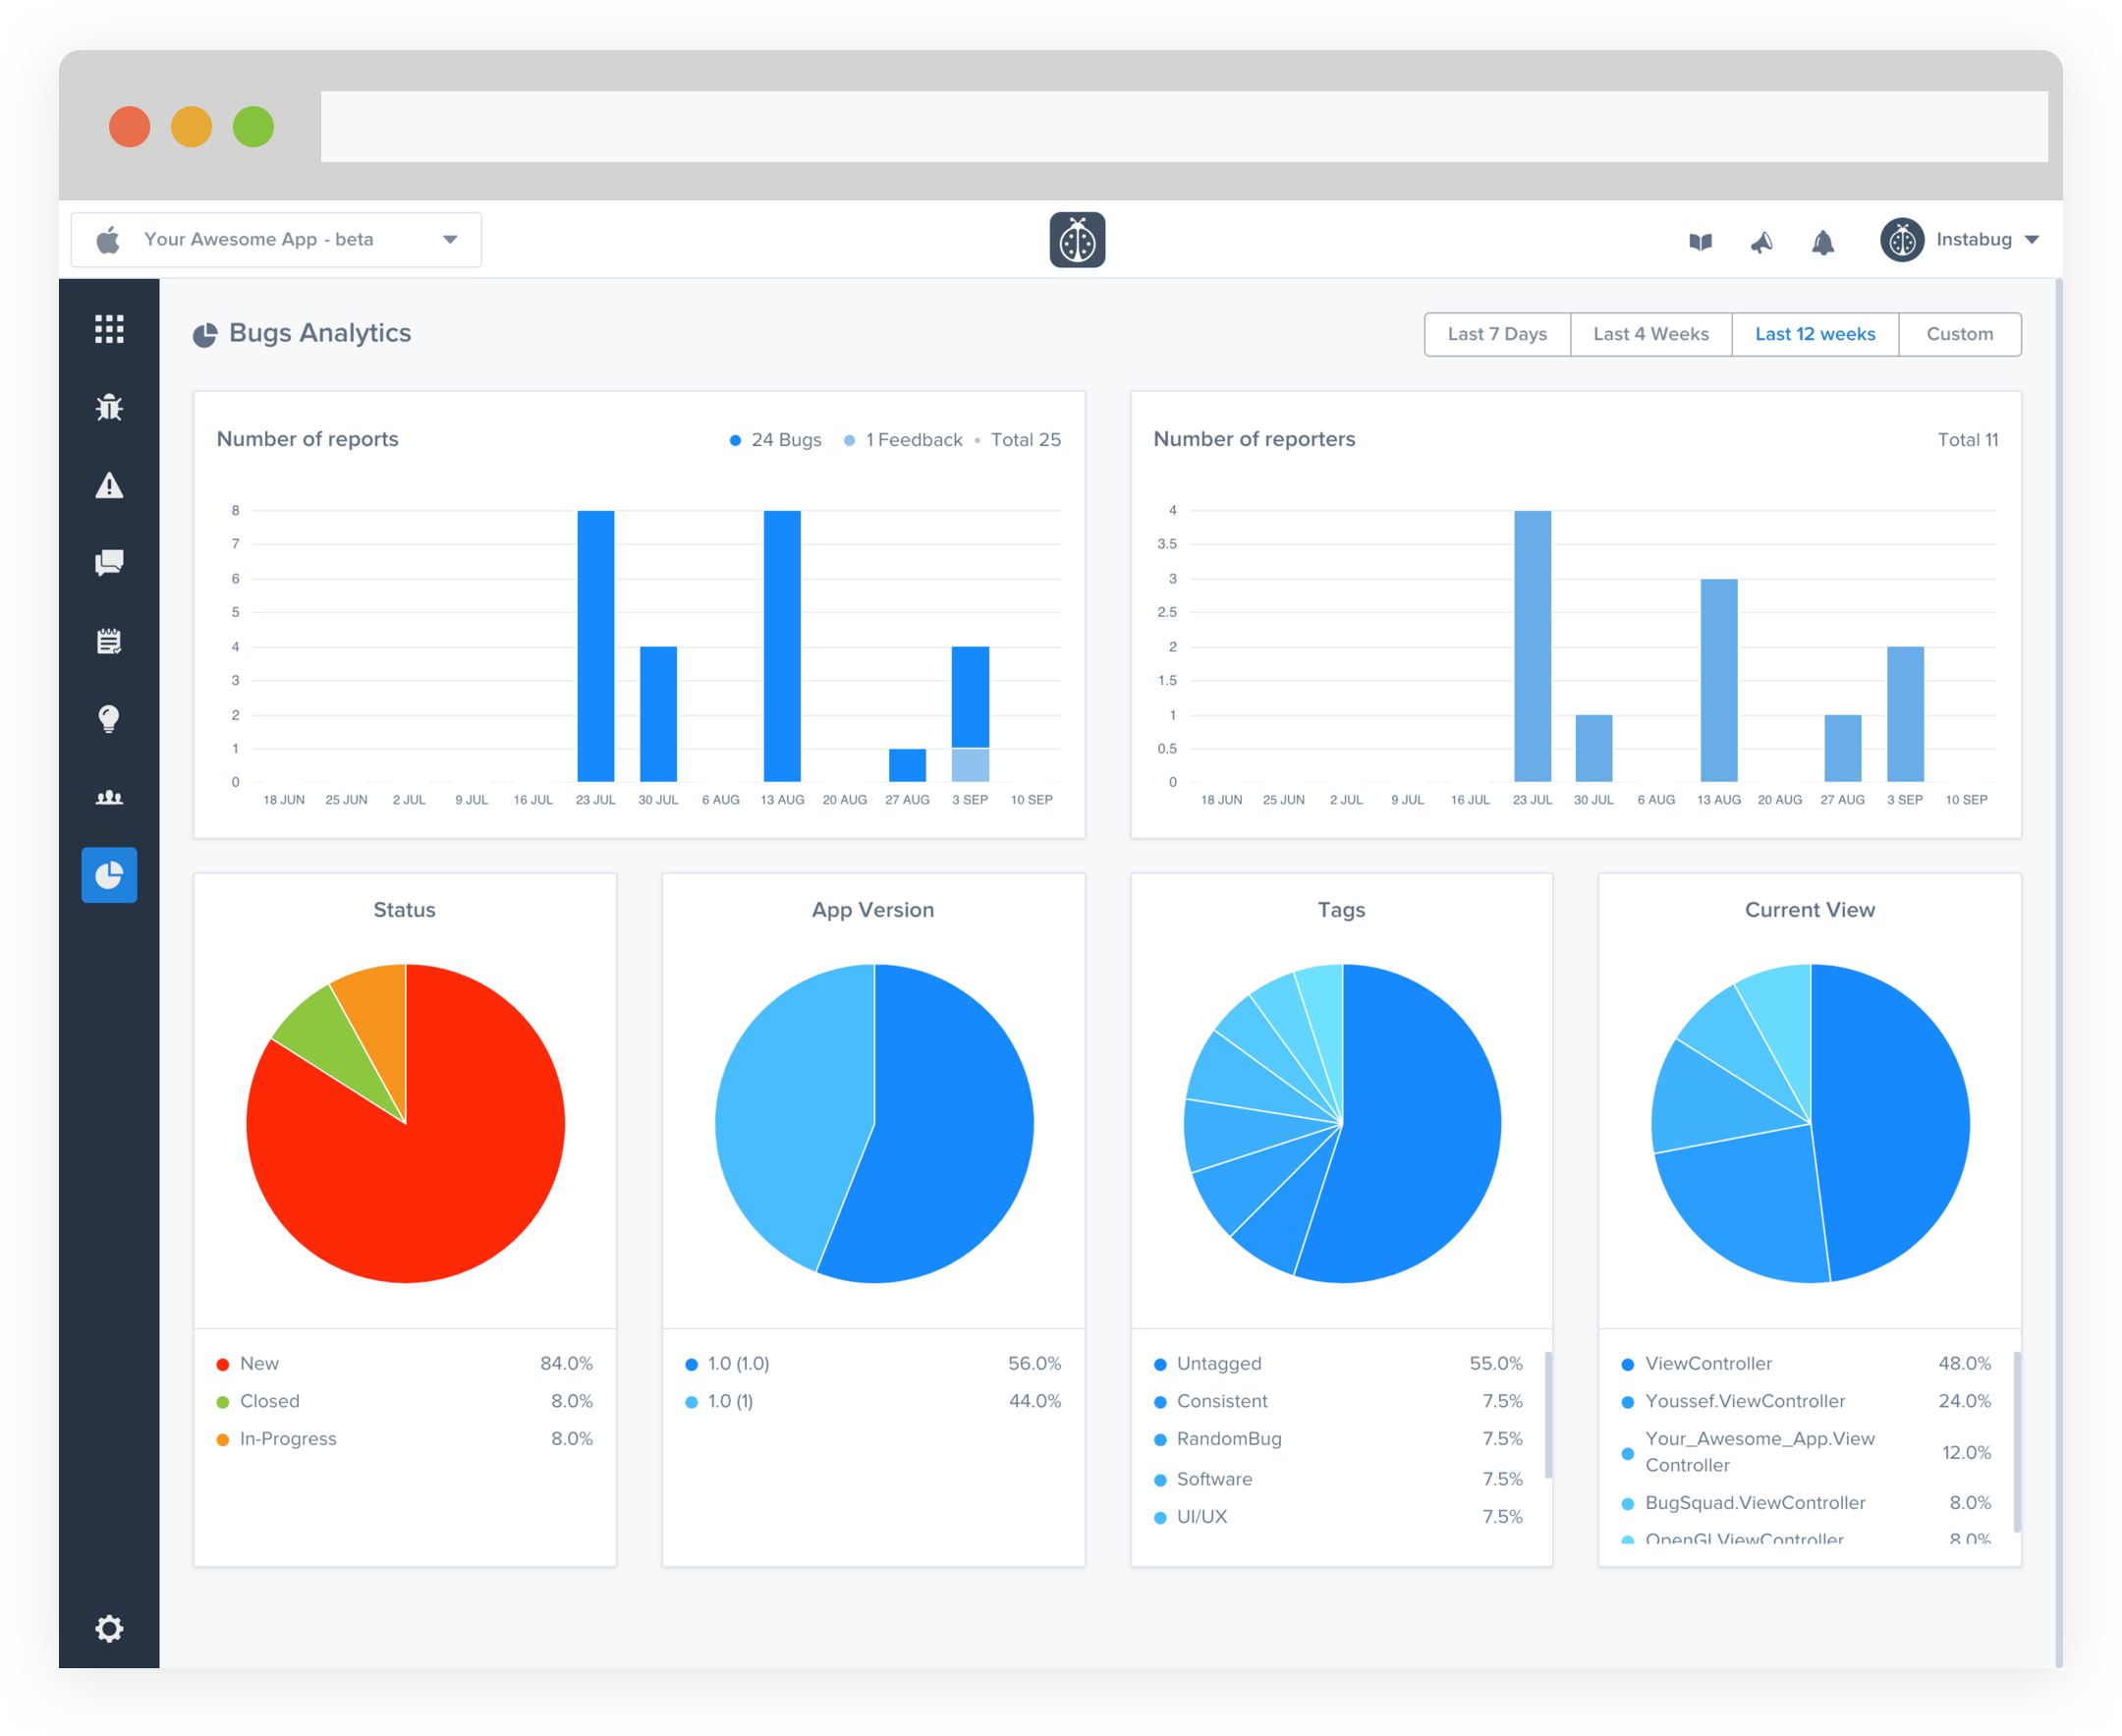
Analytics Breakdown
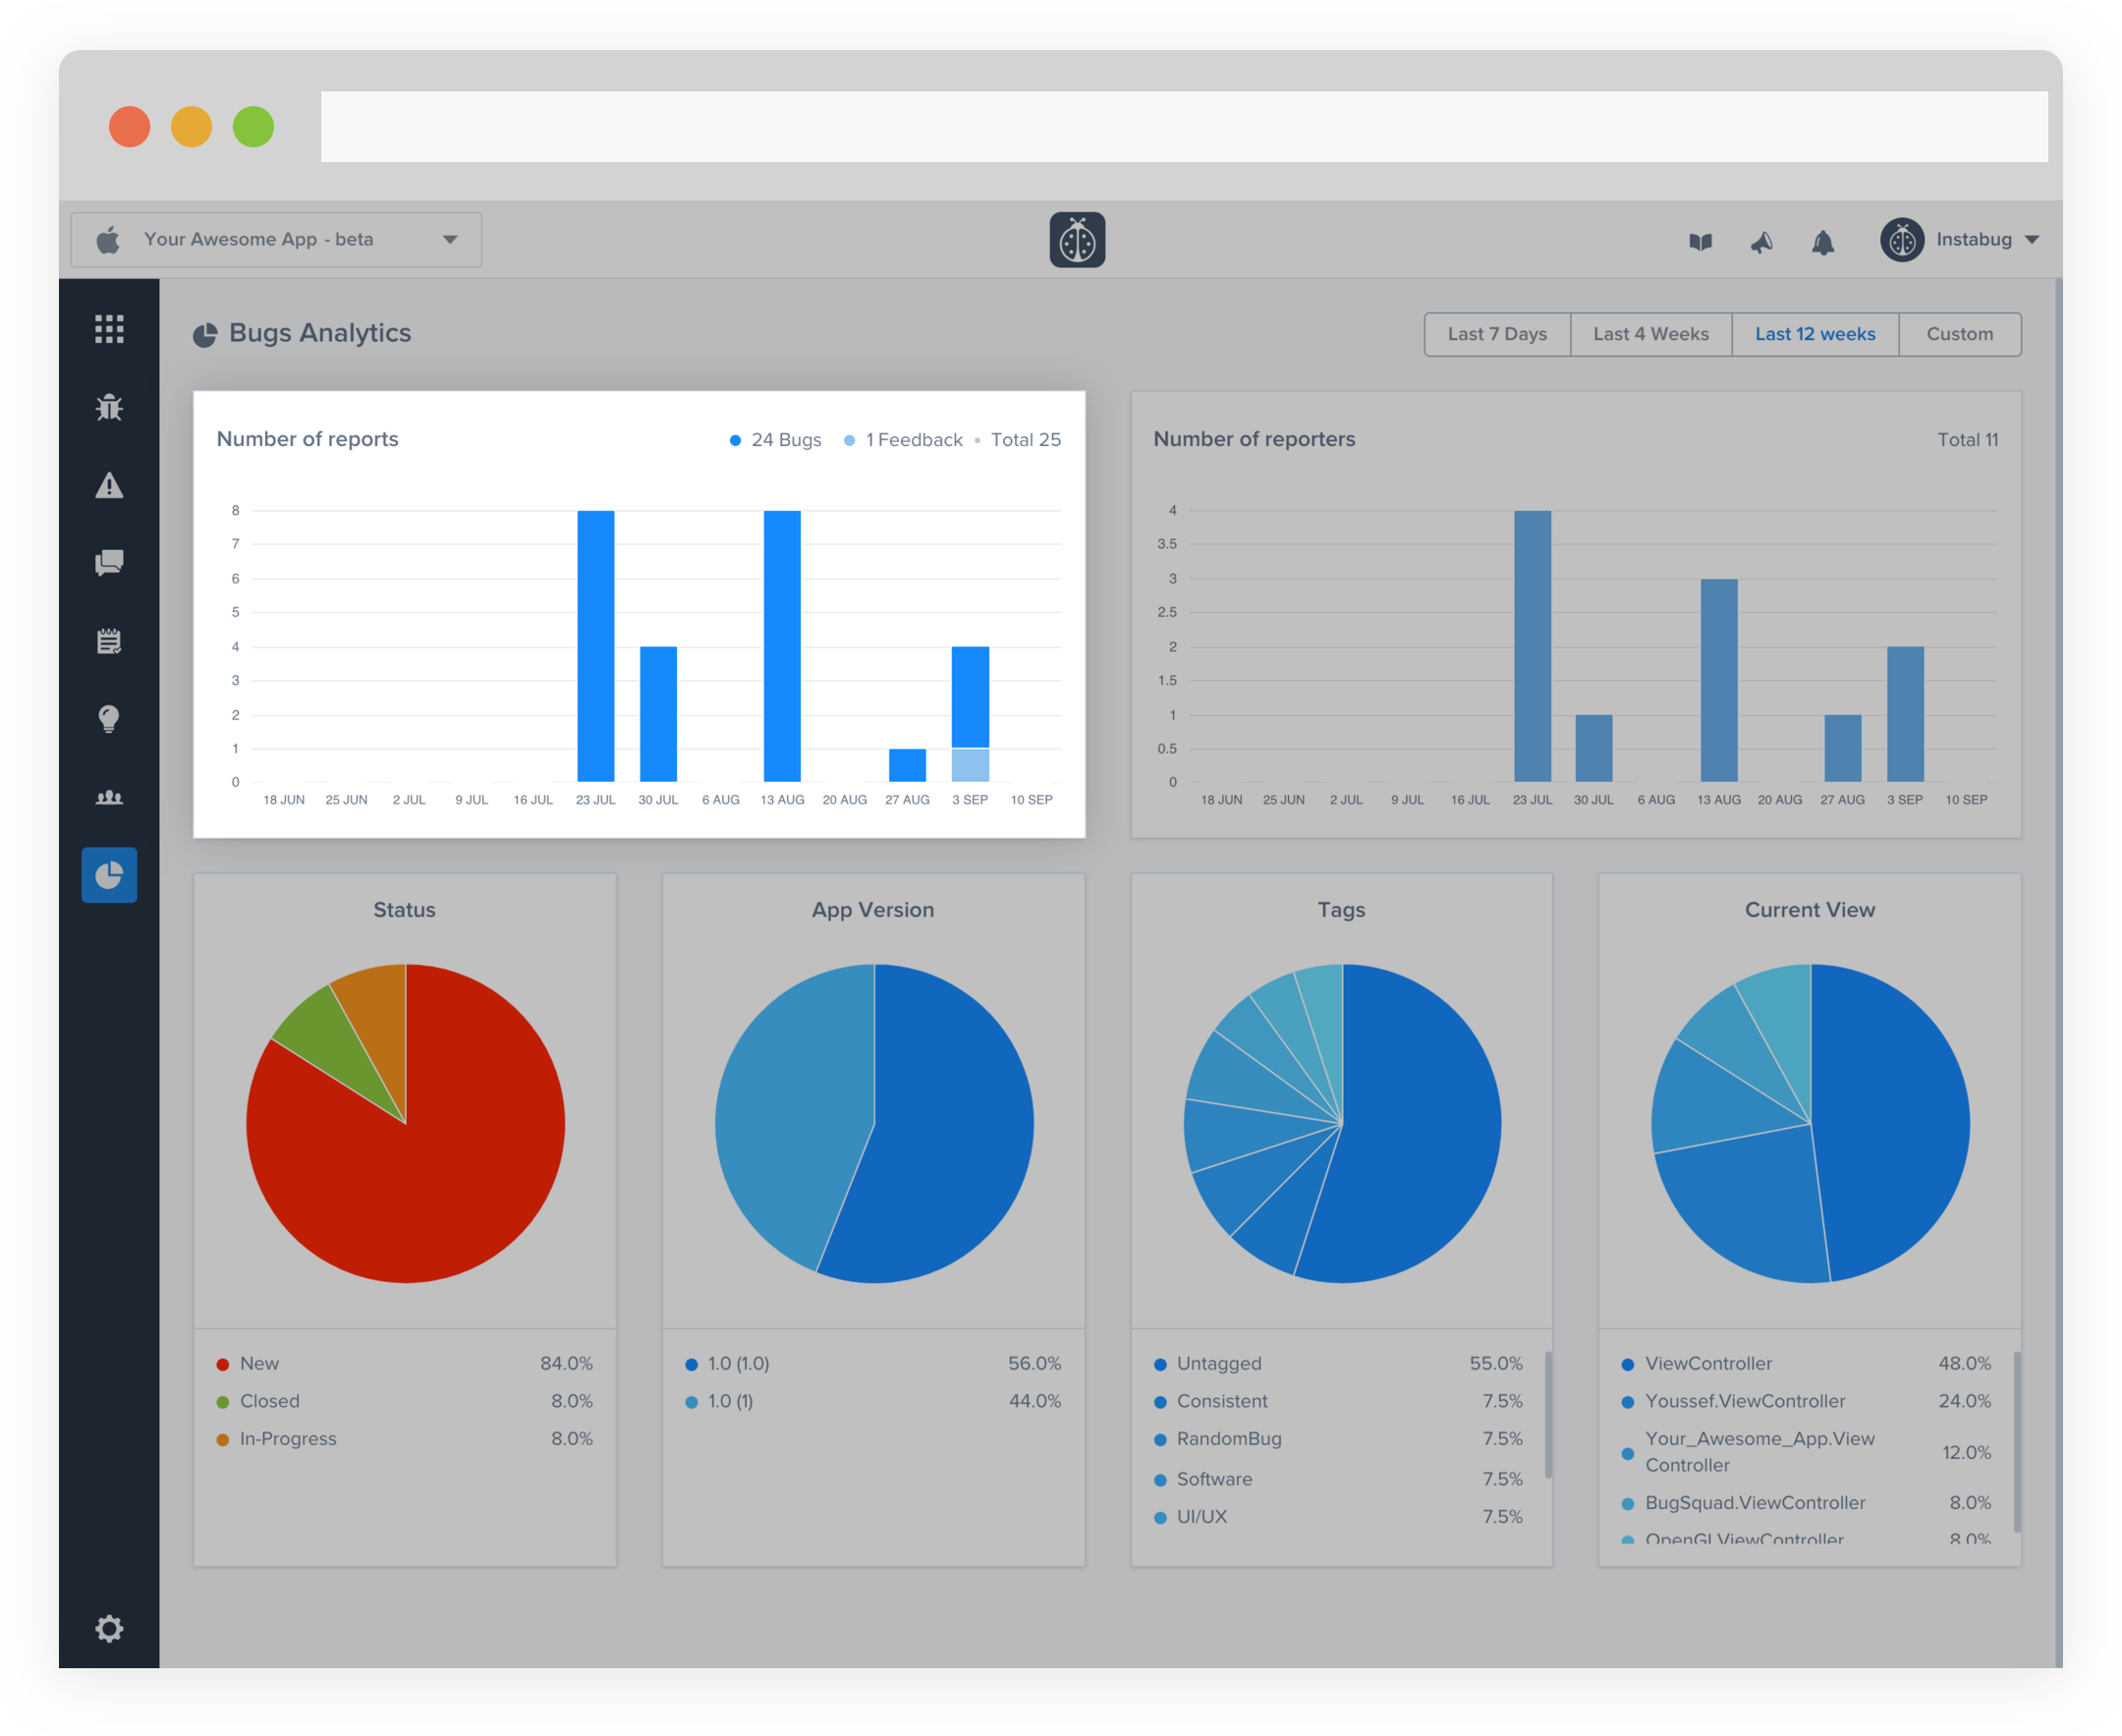
Number of Reports
This graph displays the number of reports received over a specified period of time. The date is on the x-axis and the y-axis counts the number of reports. When hovering over a bar, a breakdown will be shown detailing the number of reports that were bugs and the number of reports that were feedback.
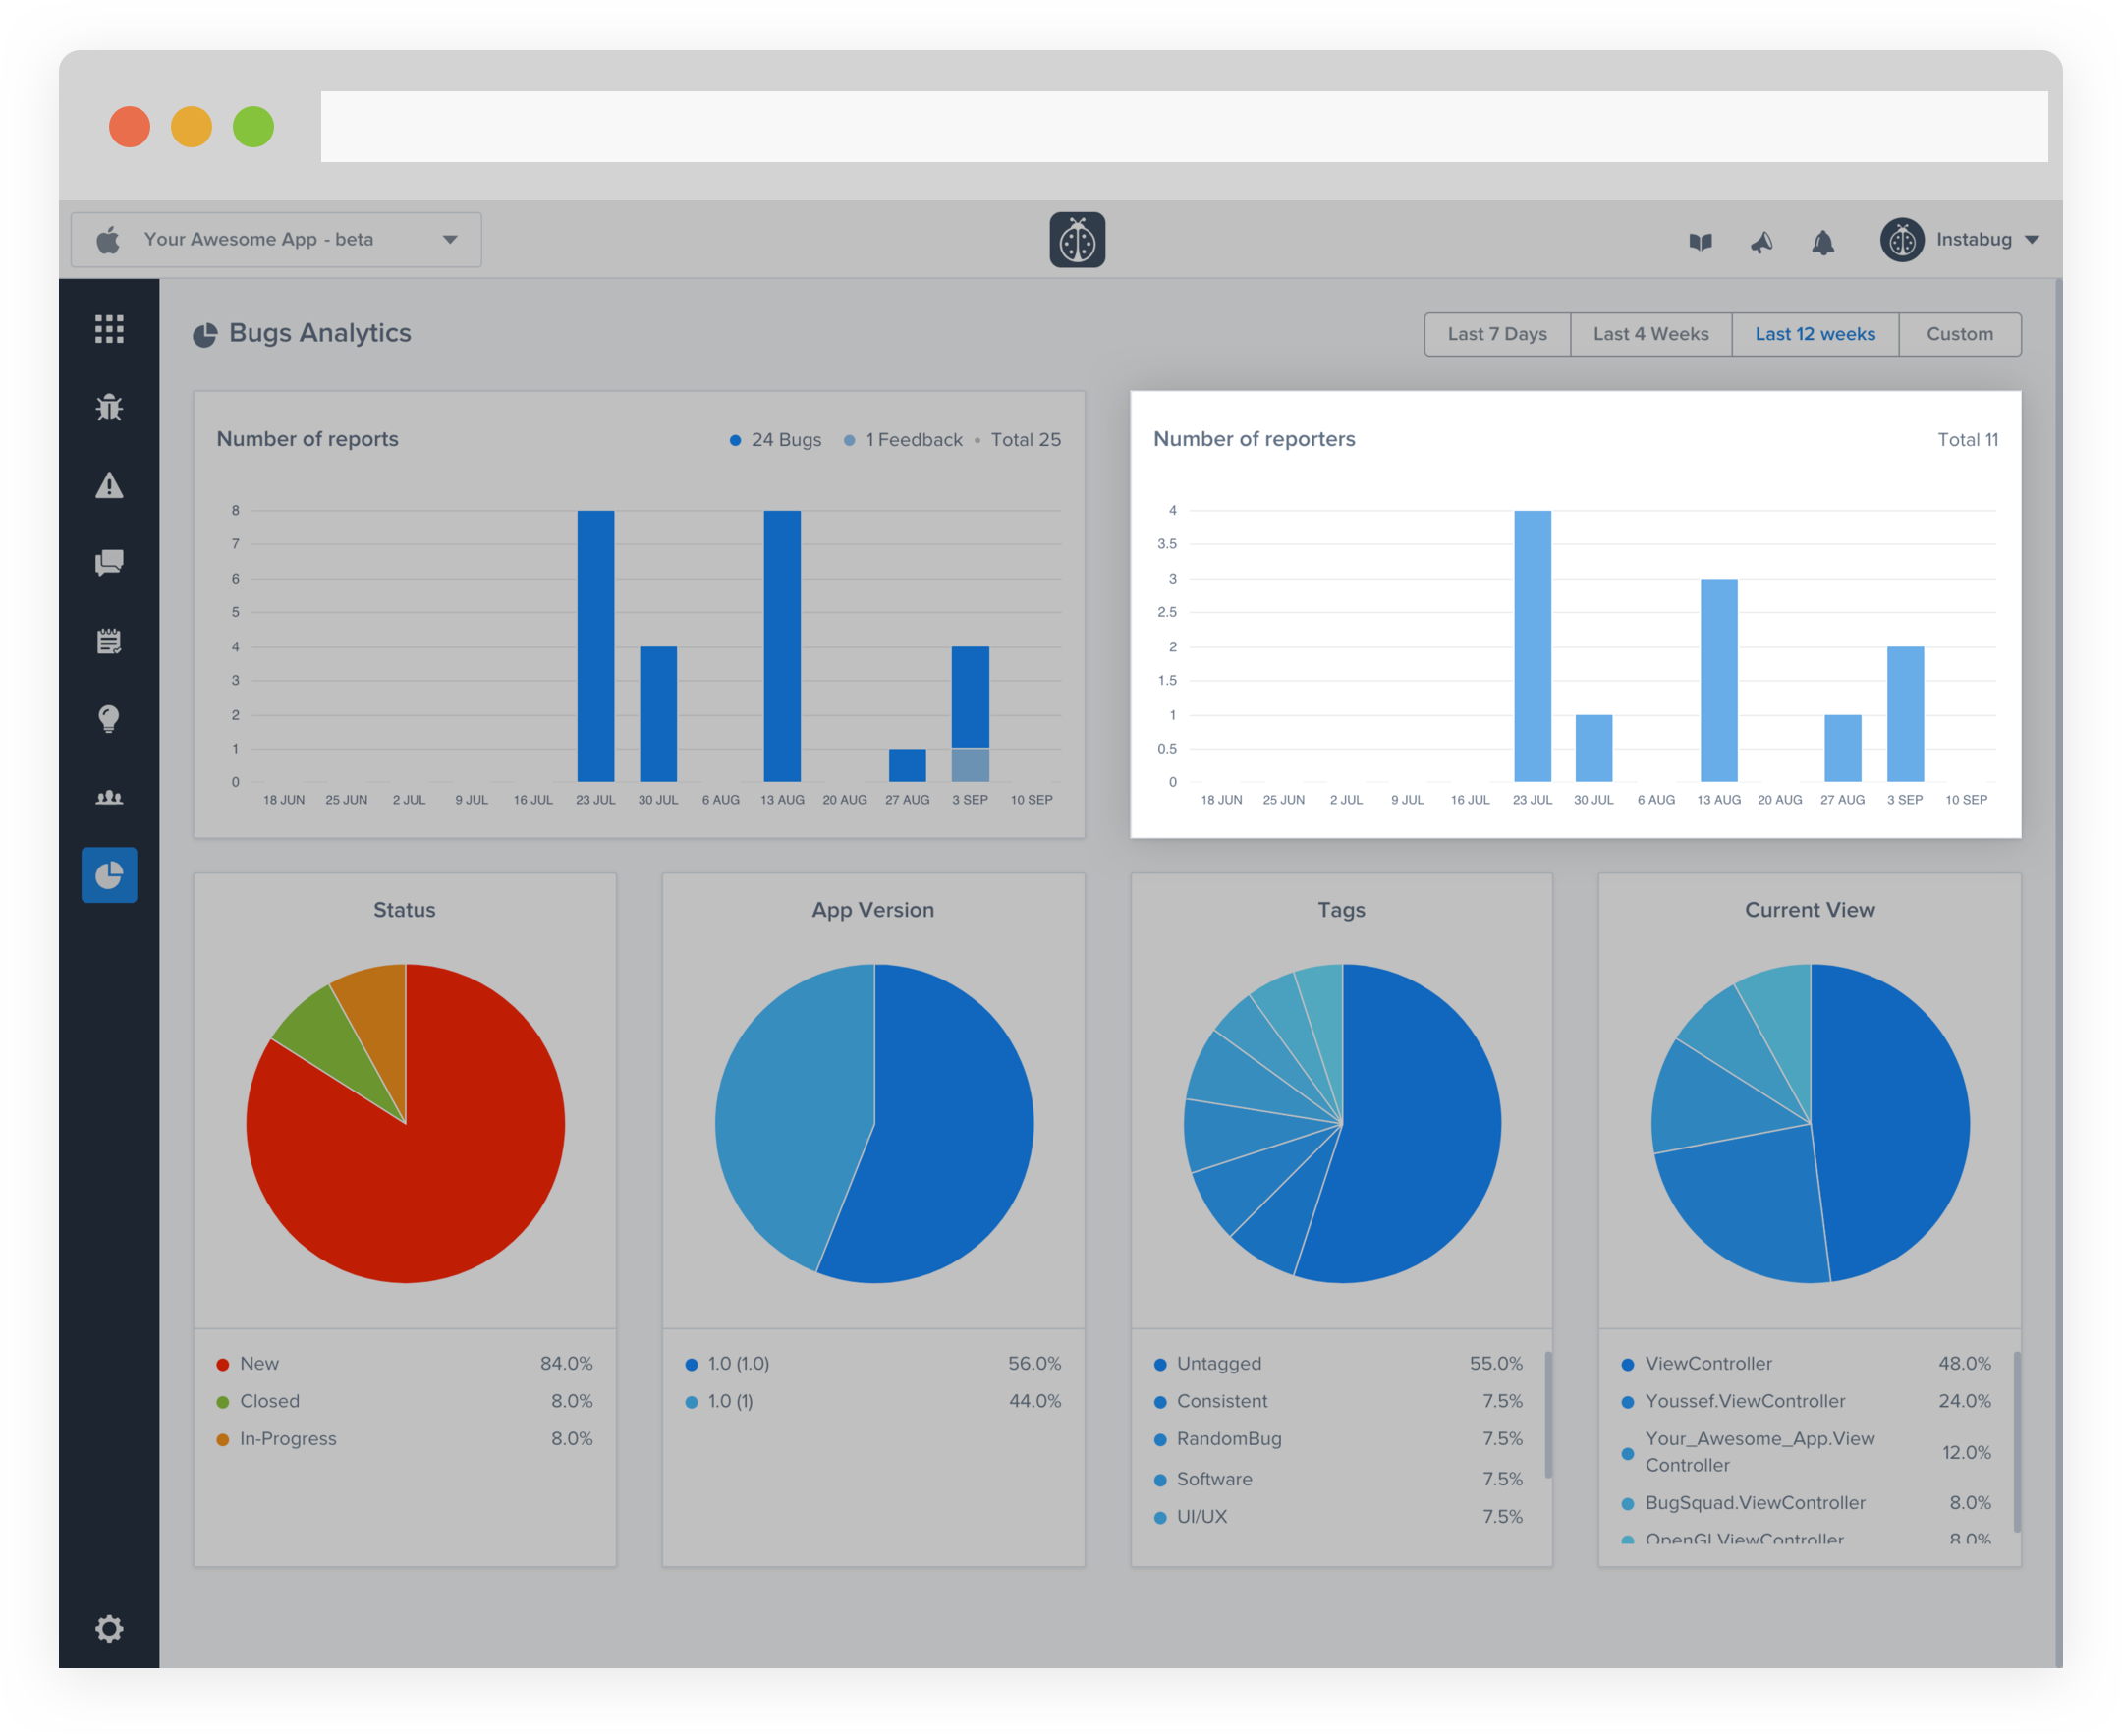
Number of Reporters
This graph displays the number of unique users that have sent bug reports. The y-axis refers to the number of reporters while the x-axis refers to the date. When hovering over a bar, the specific number of reporters will be shown.
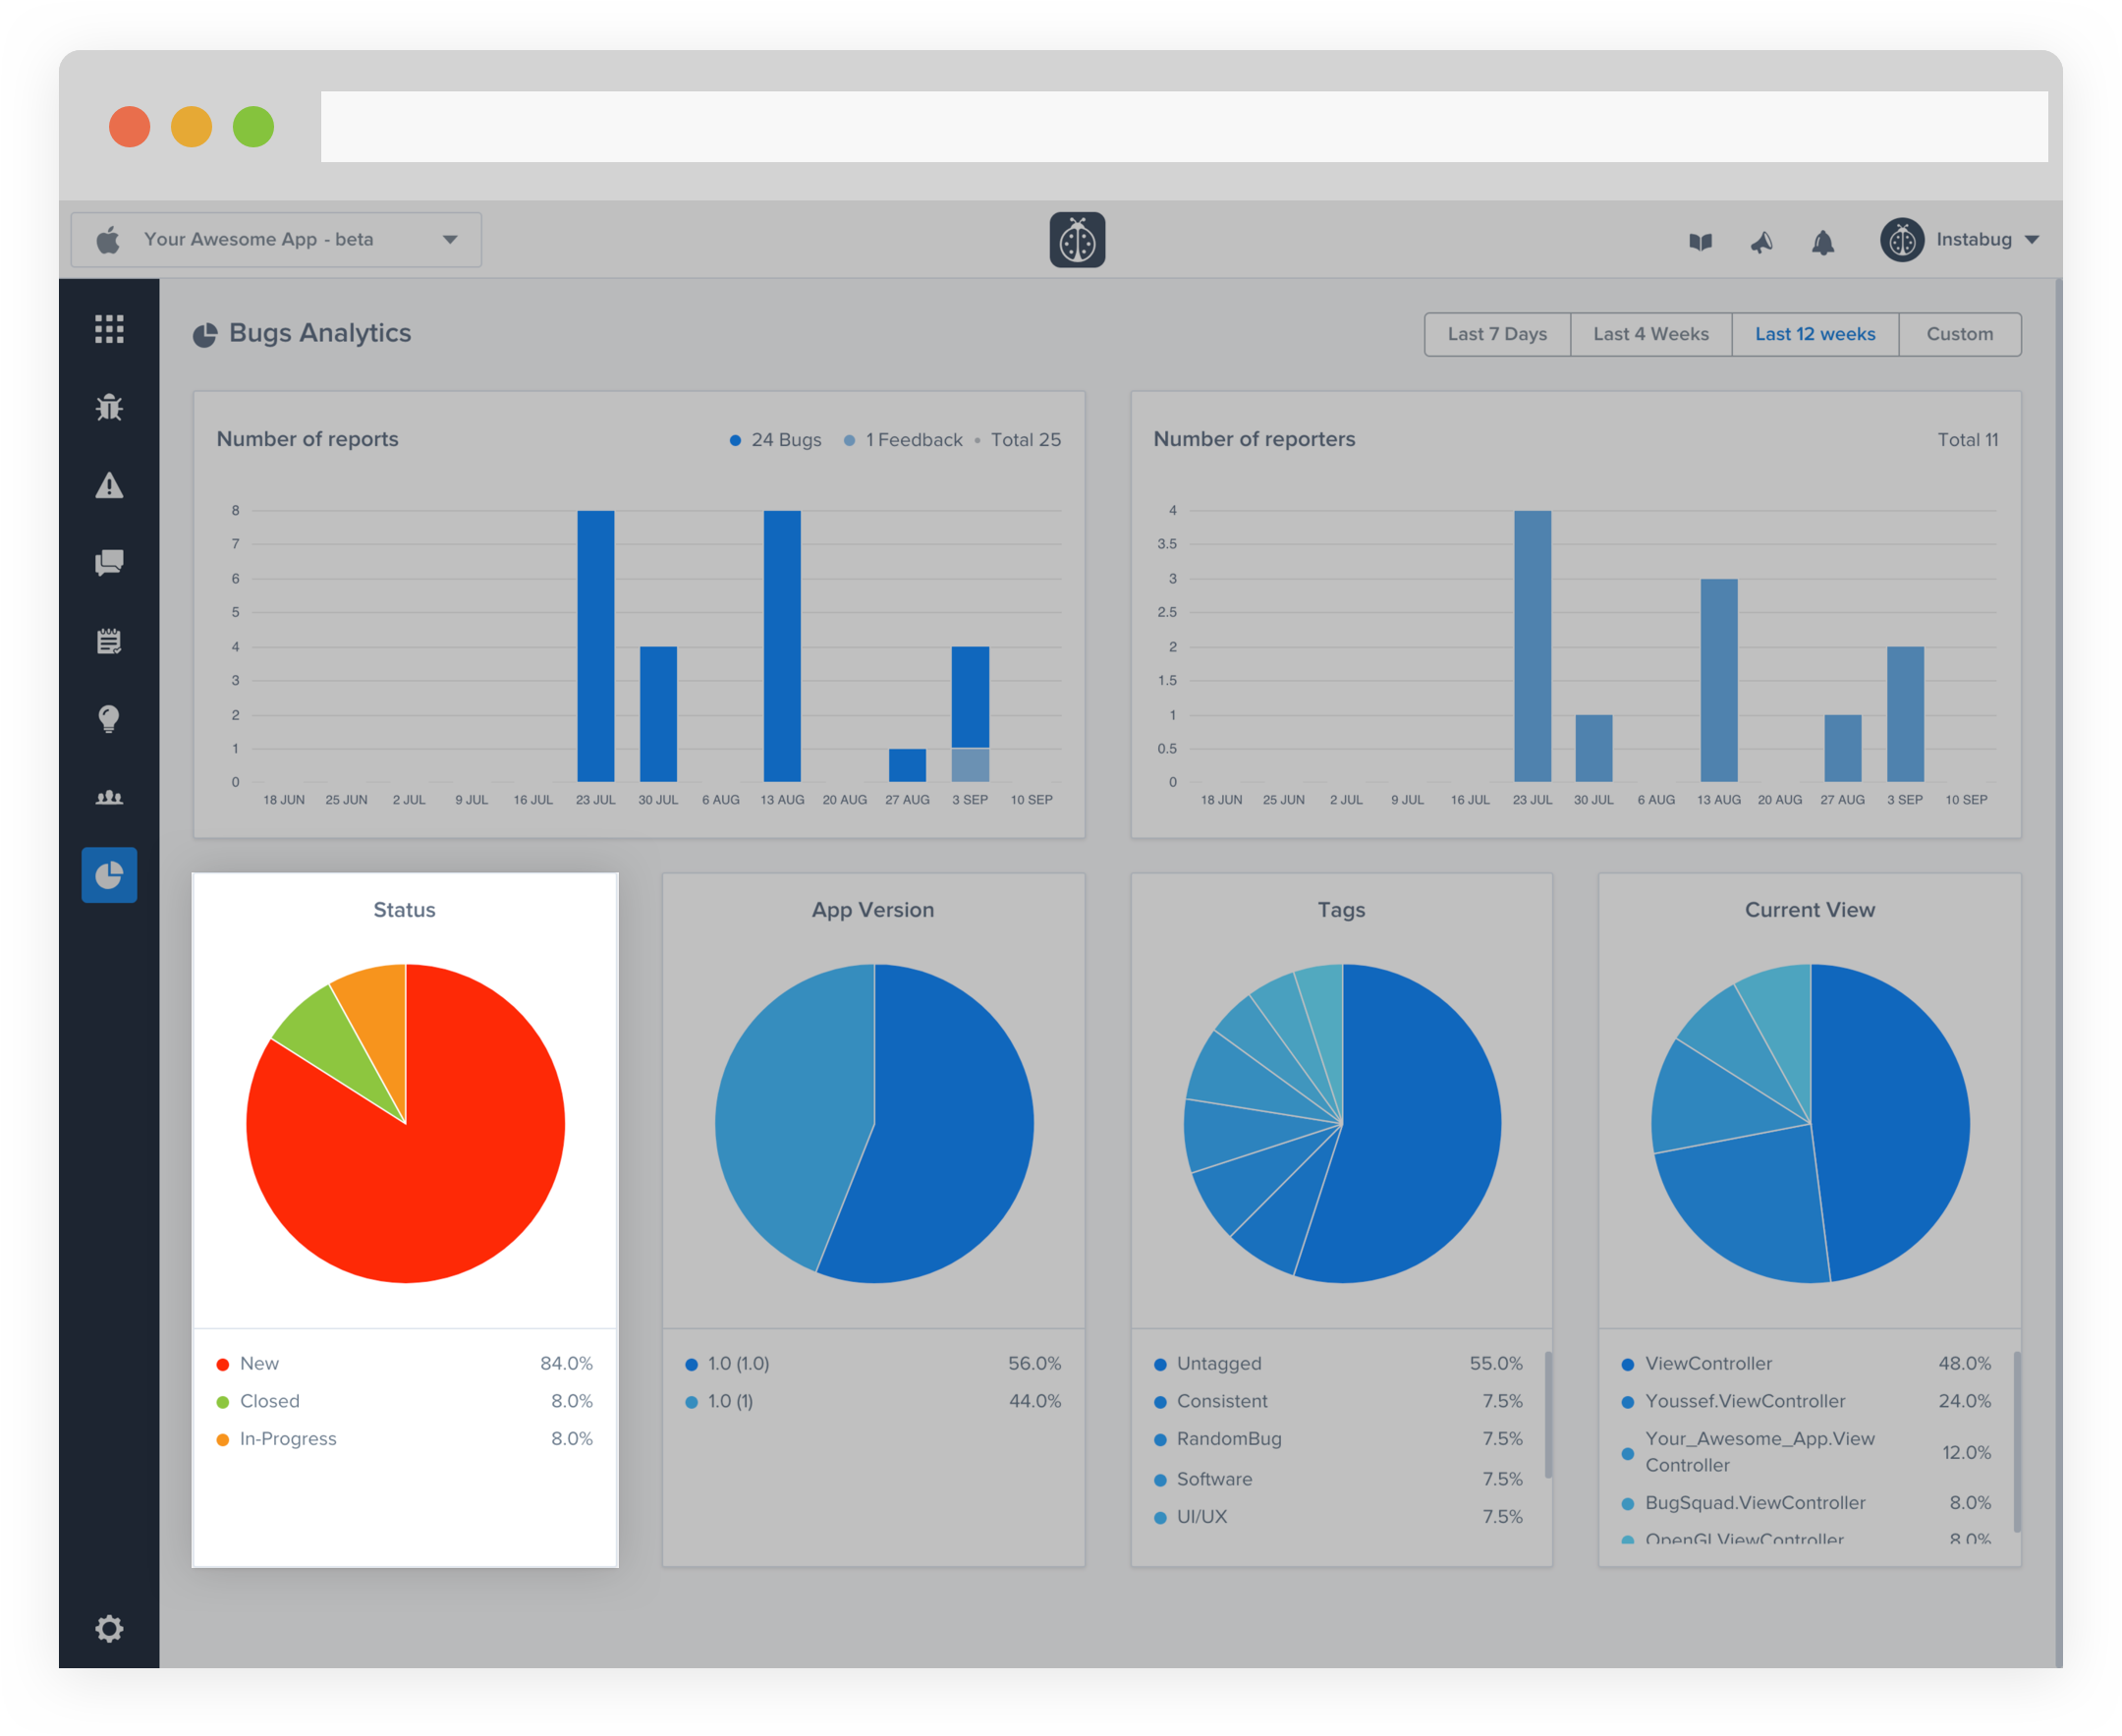
Status
This pie chart displays a breakdown of the current status of your bug reports. The pie chart consists of three parts: "New," "In-progress," and "Closed." When hovering over a part of the pie chart, the specific number of reports with that status will be shown.
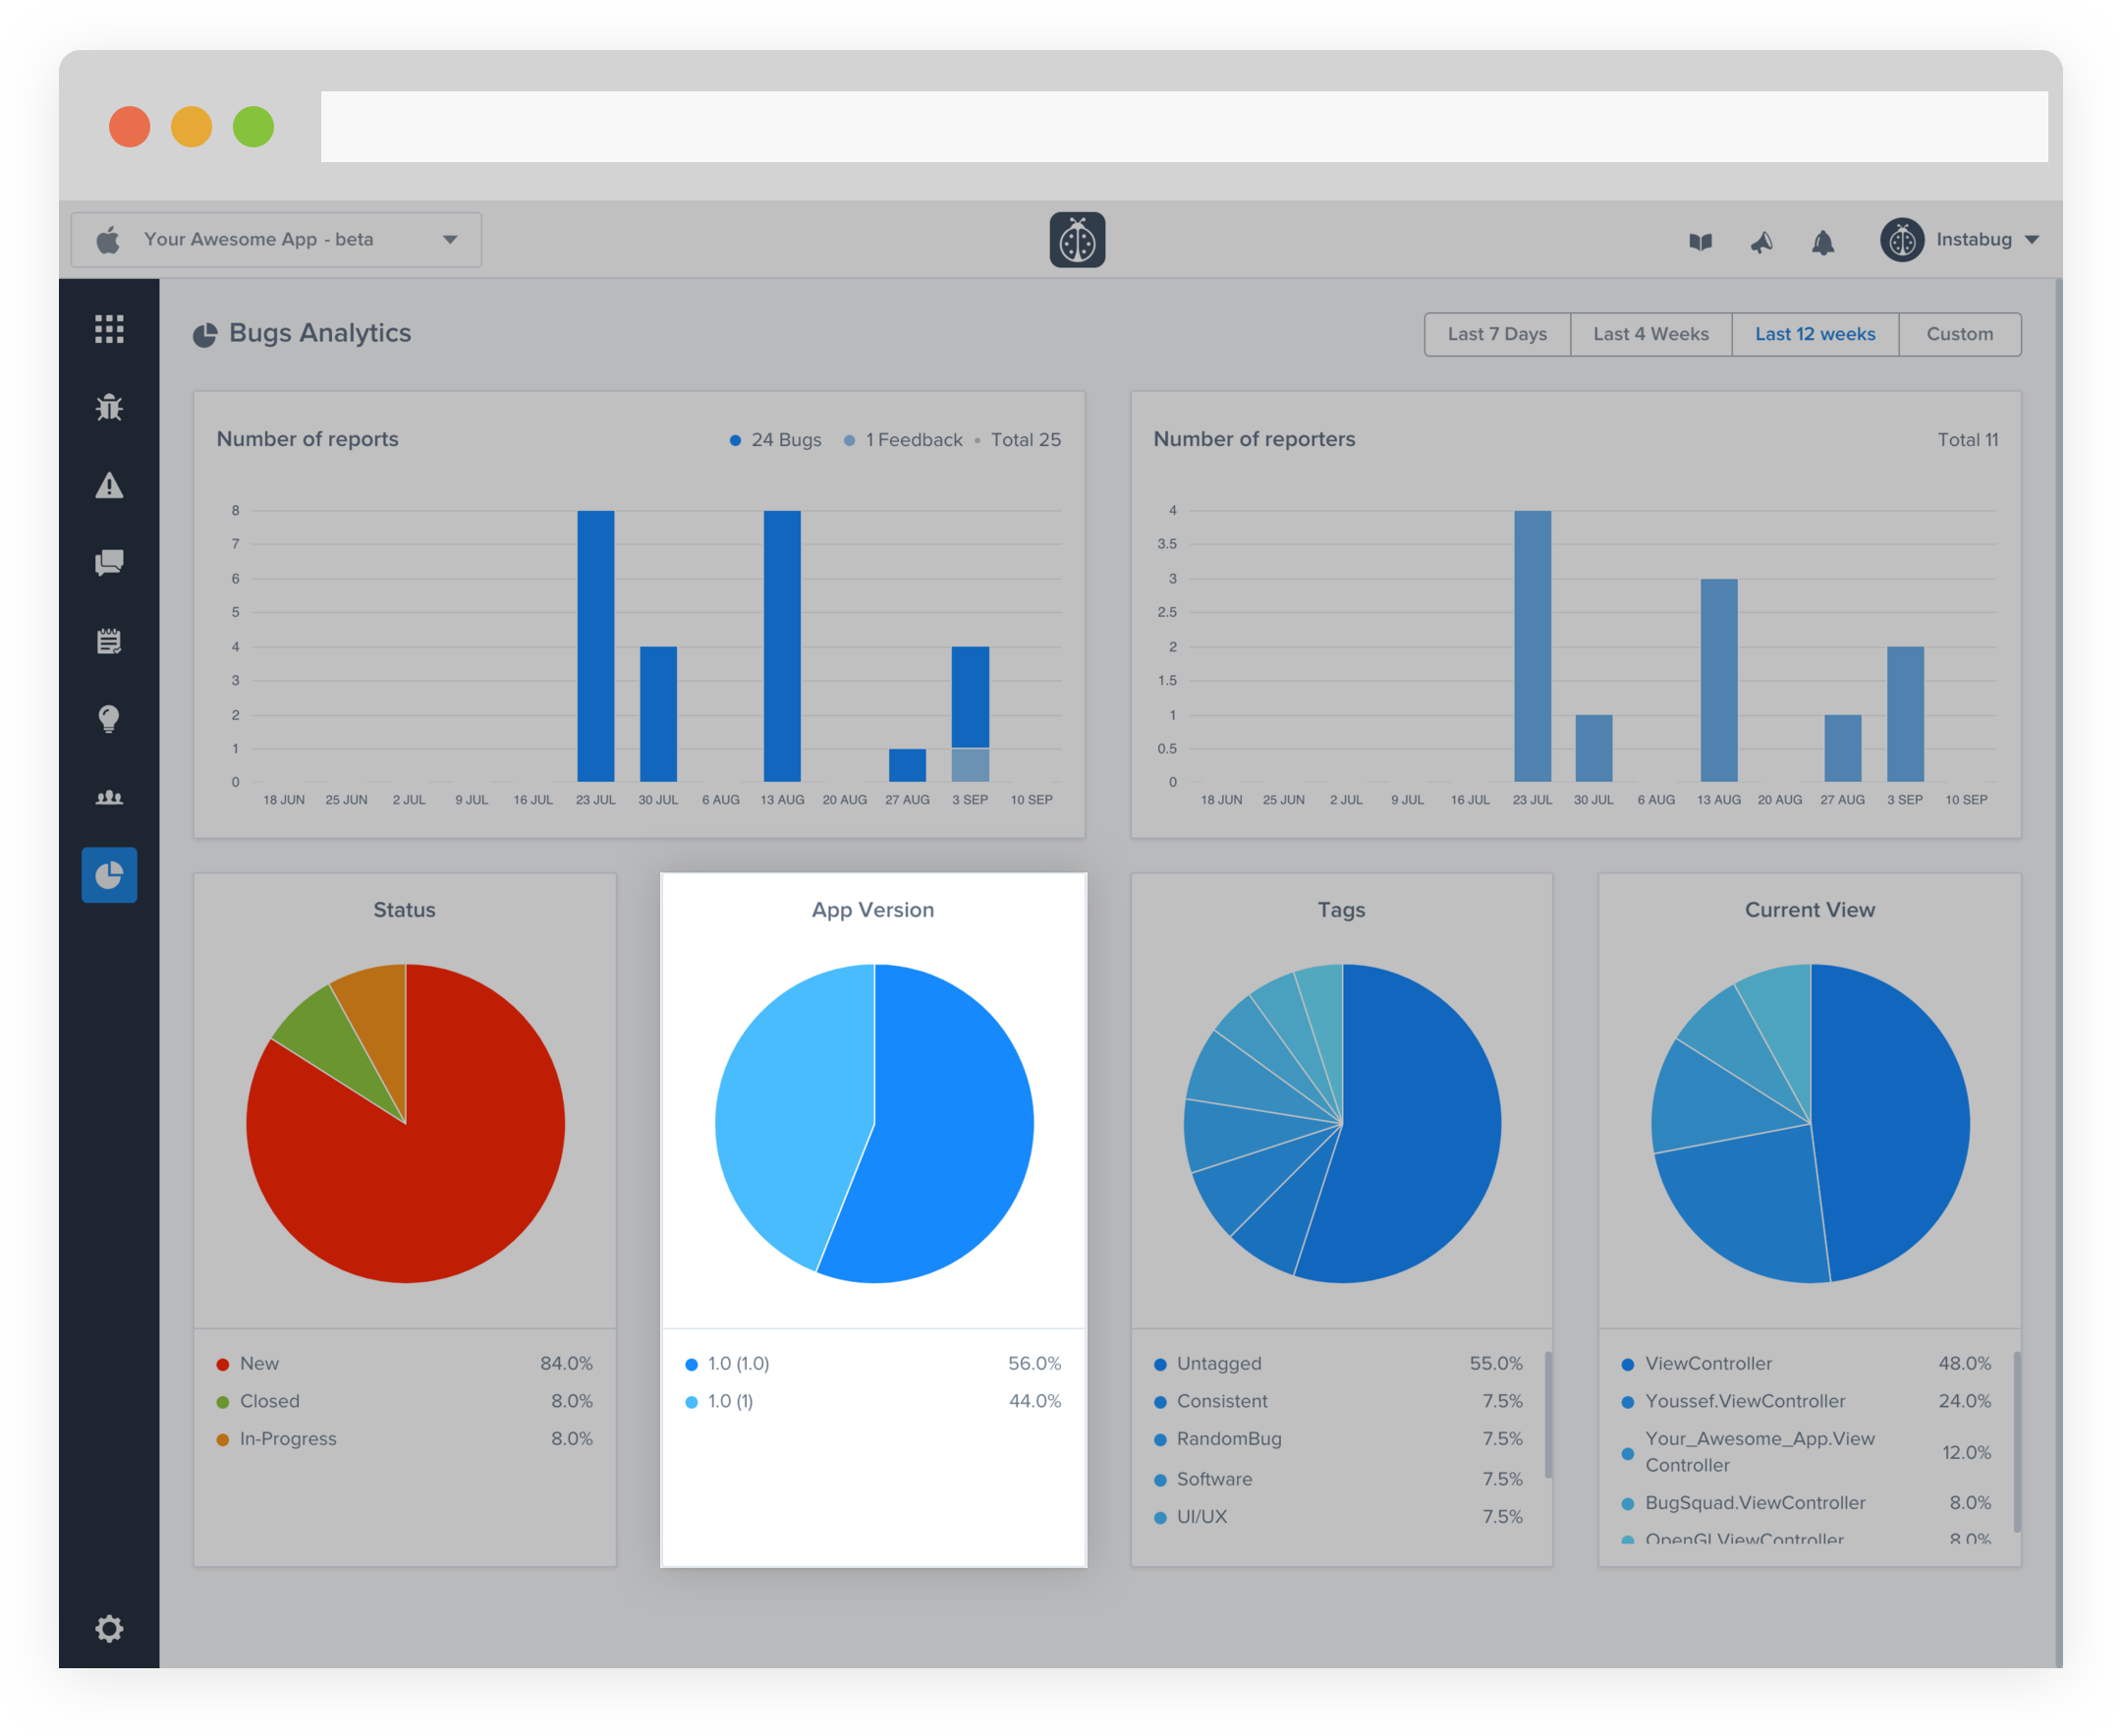
App Version
This pie chart displays a breakdown of the bug reports by app version. The pie chart consists of parts equal to the number of app versions available within the specified time frame. When hovering over a slice of the pie chart, the specific number of reports from that app version will be shown.
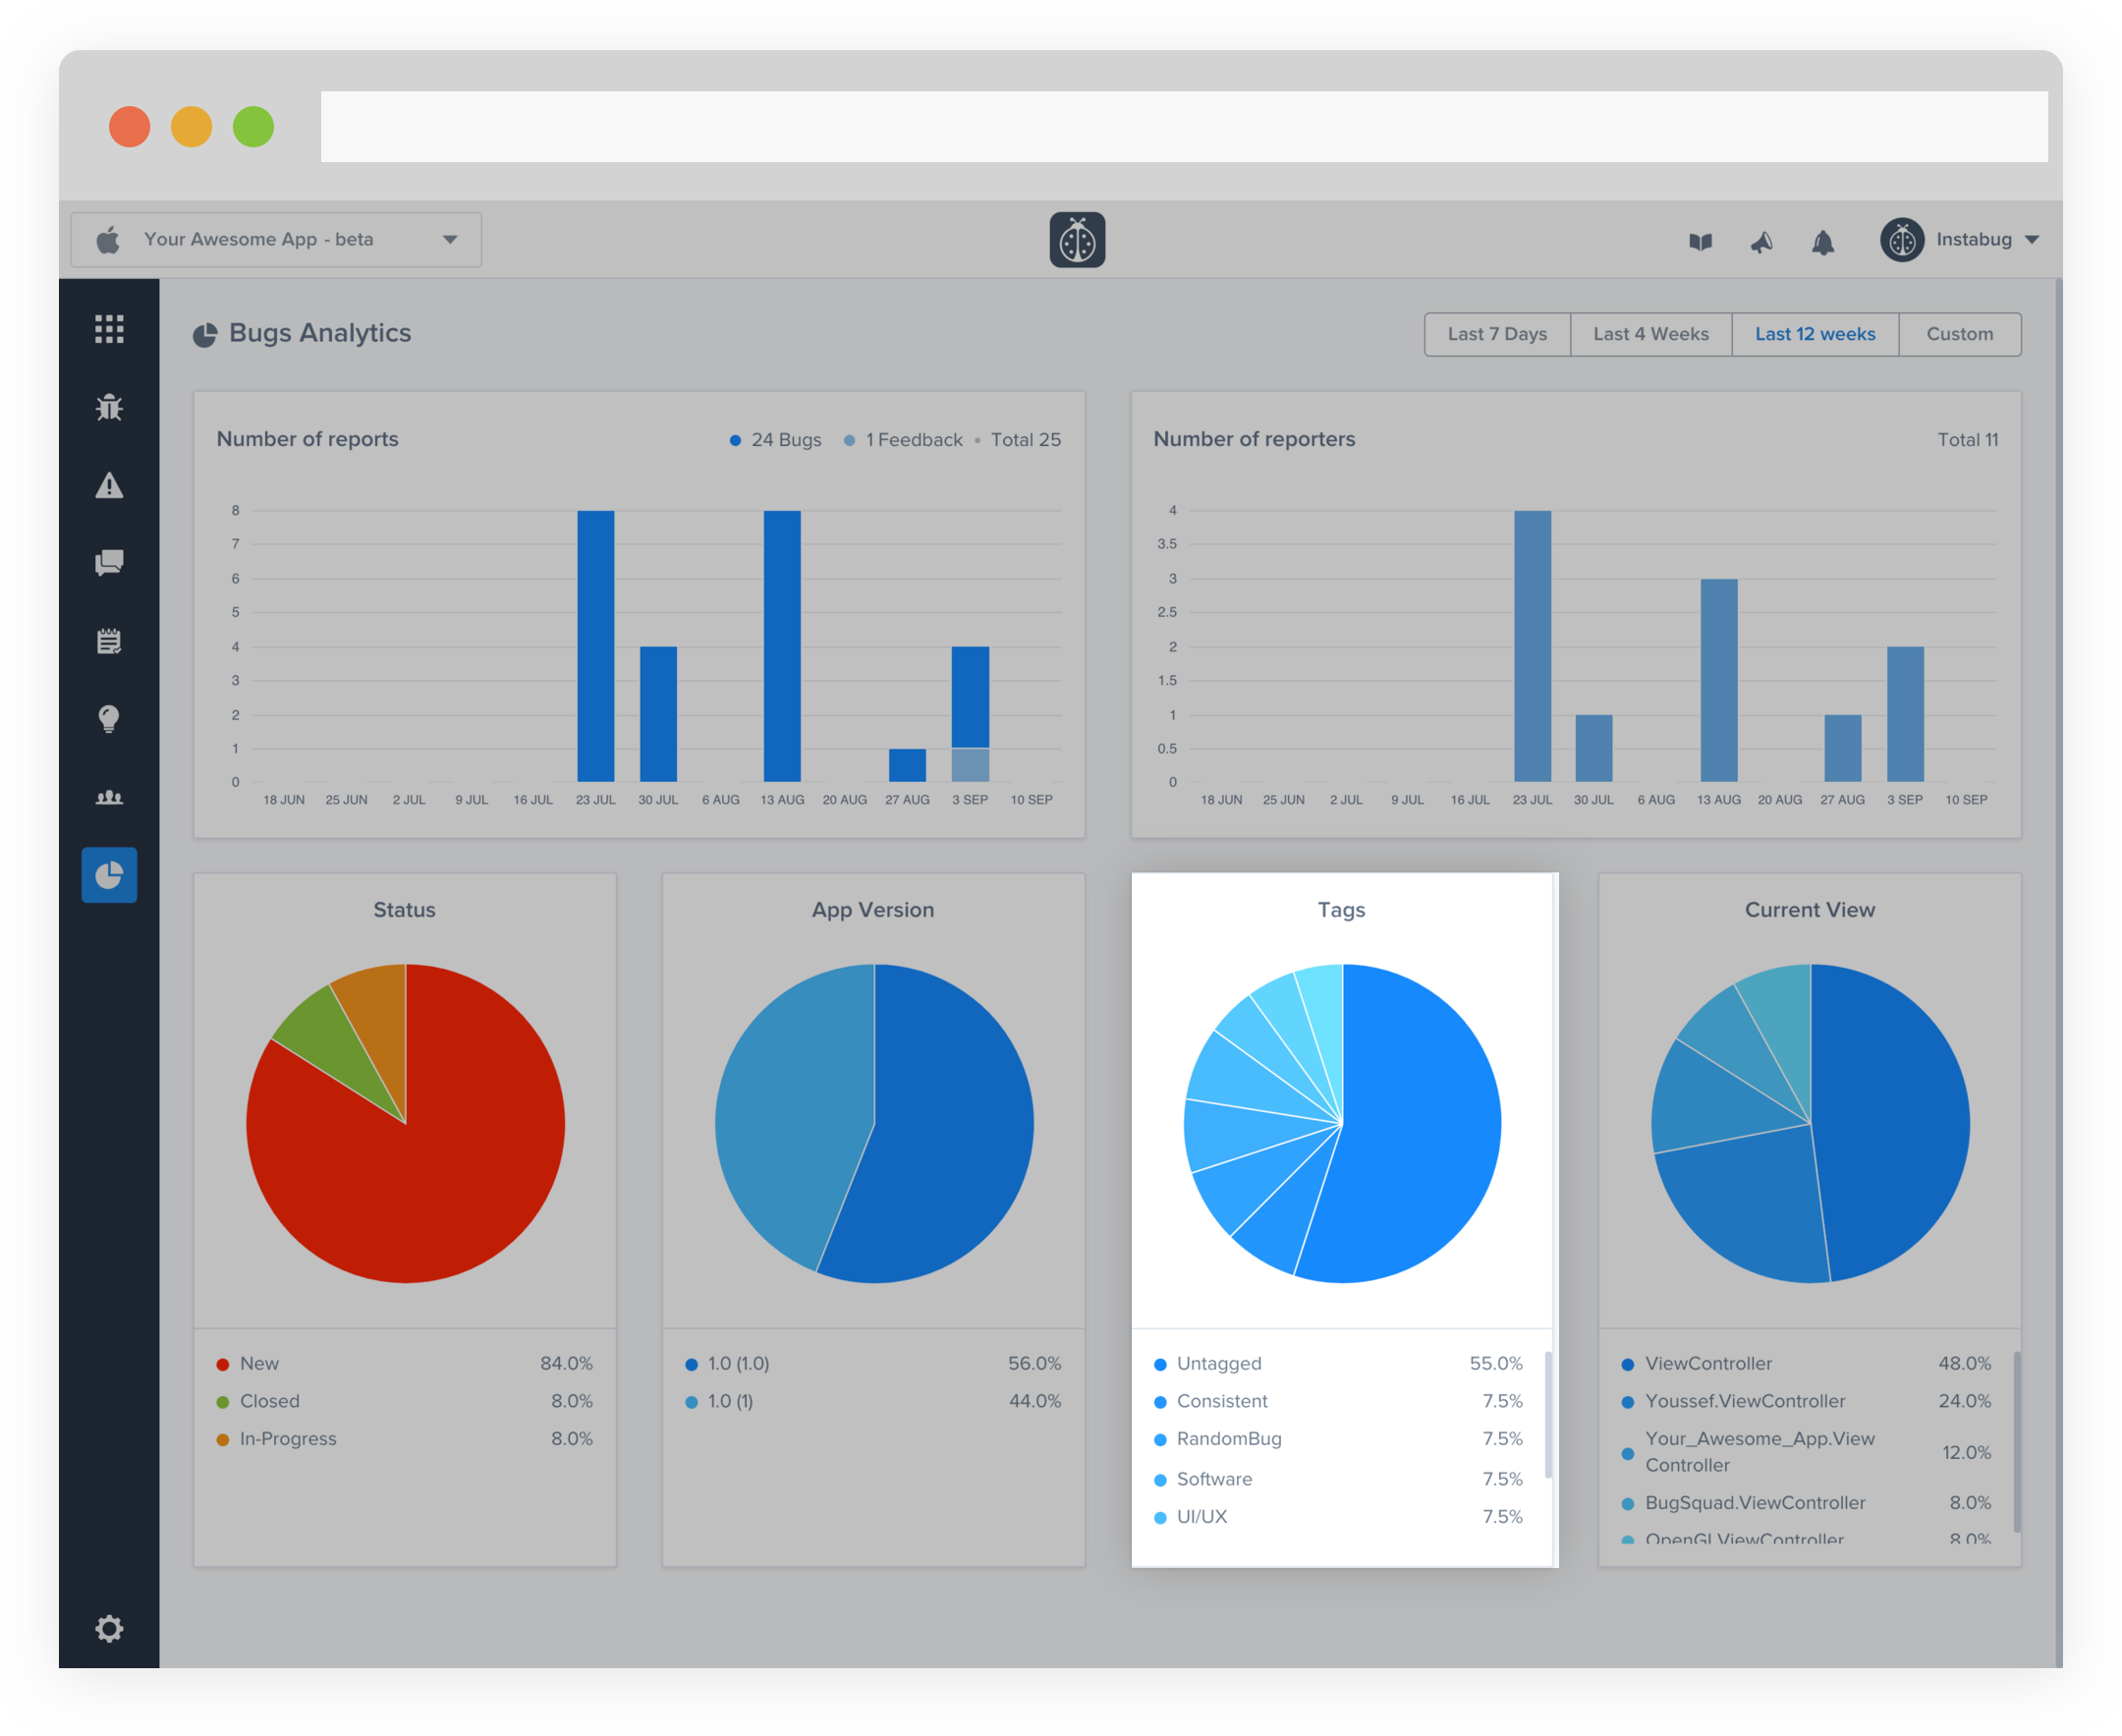
Tags
This pie chart displays a breakdown of the bug reports by tags. The pie chart consists of parts equal to the number of tags available within the specified time frame. When hovering over a slice of the pie chart, the specific number of reports with that tag will be shown.
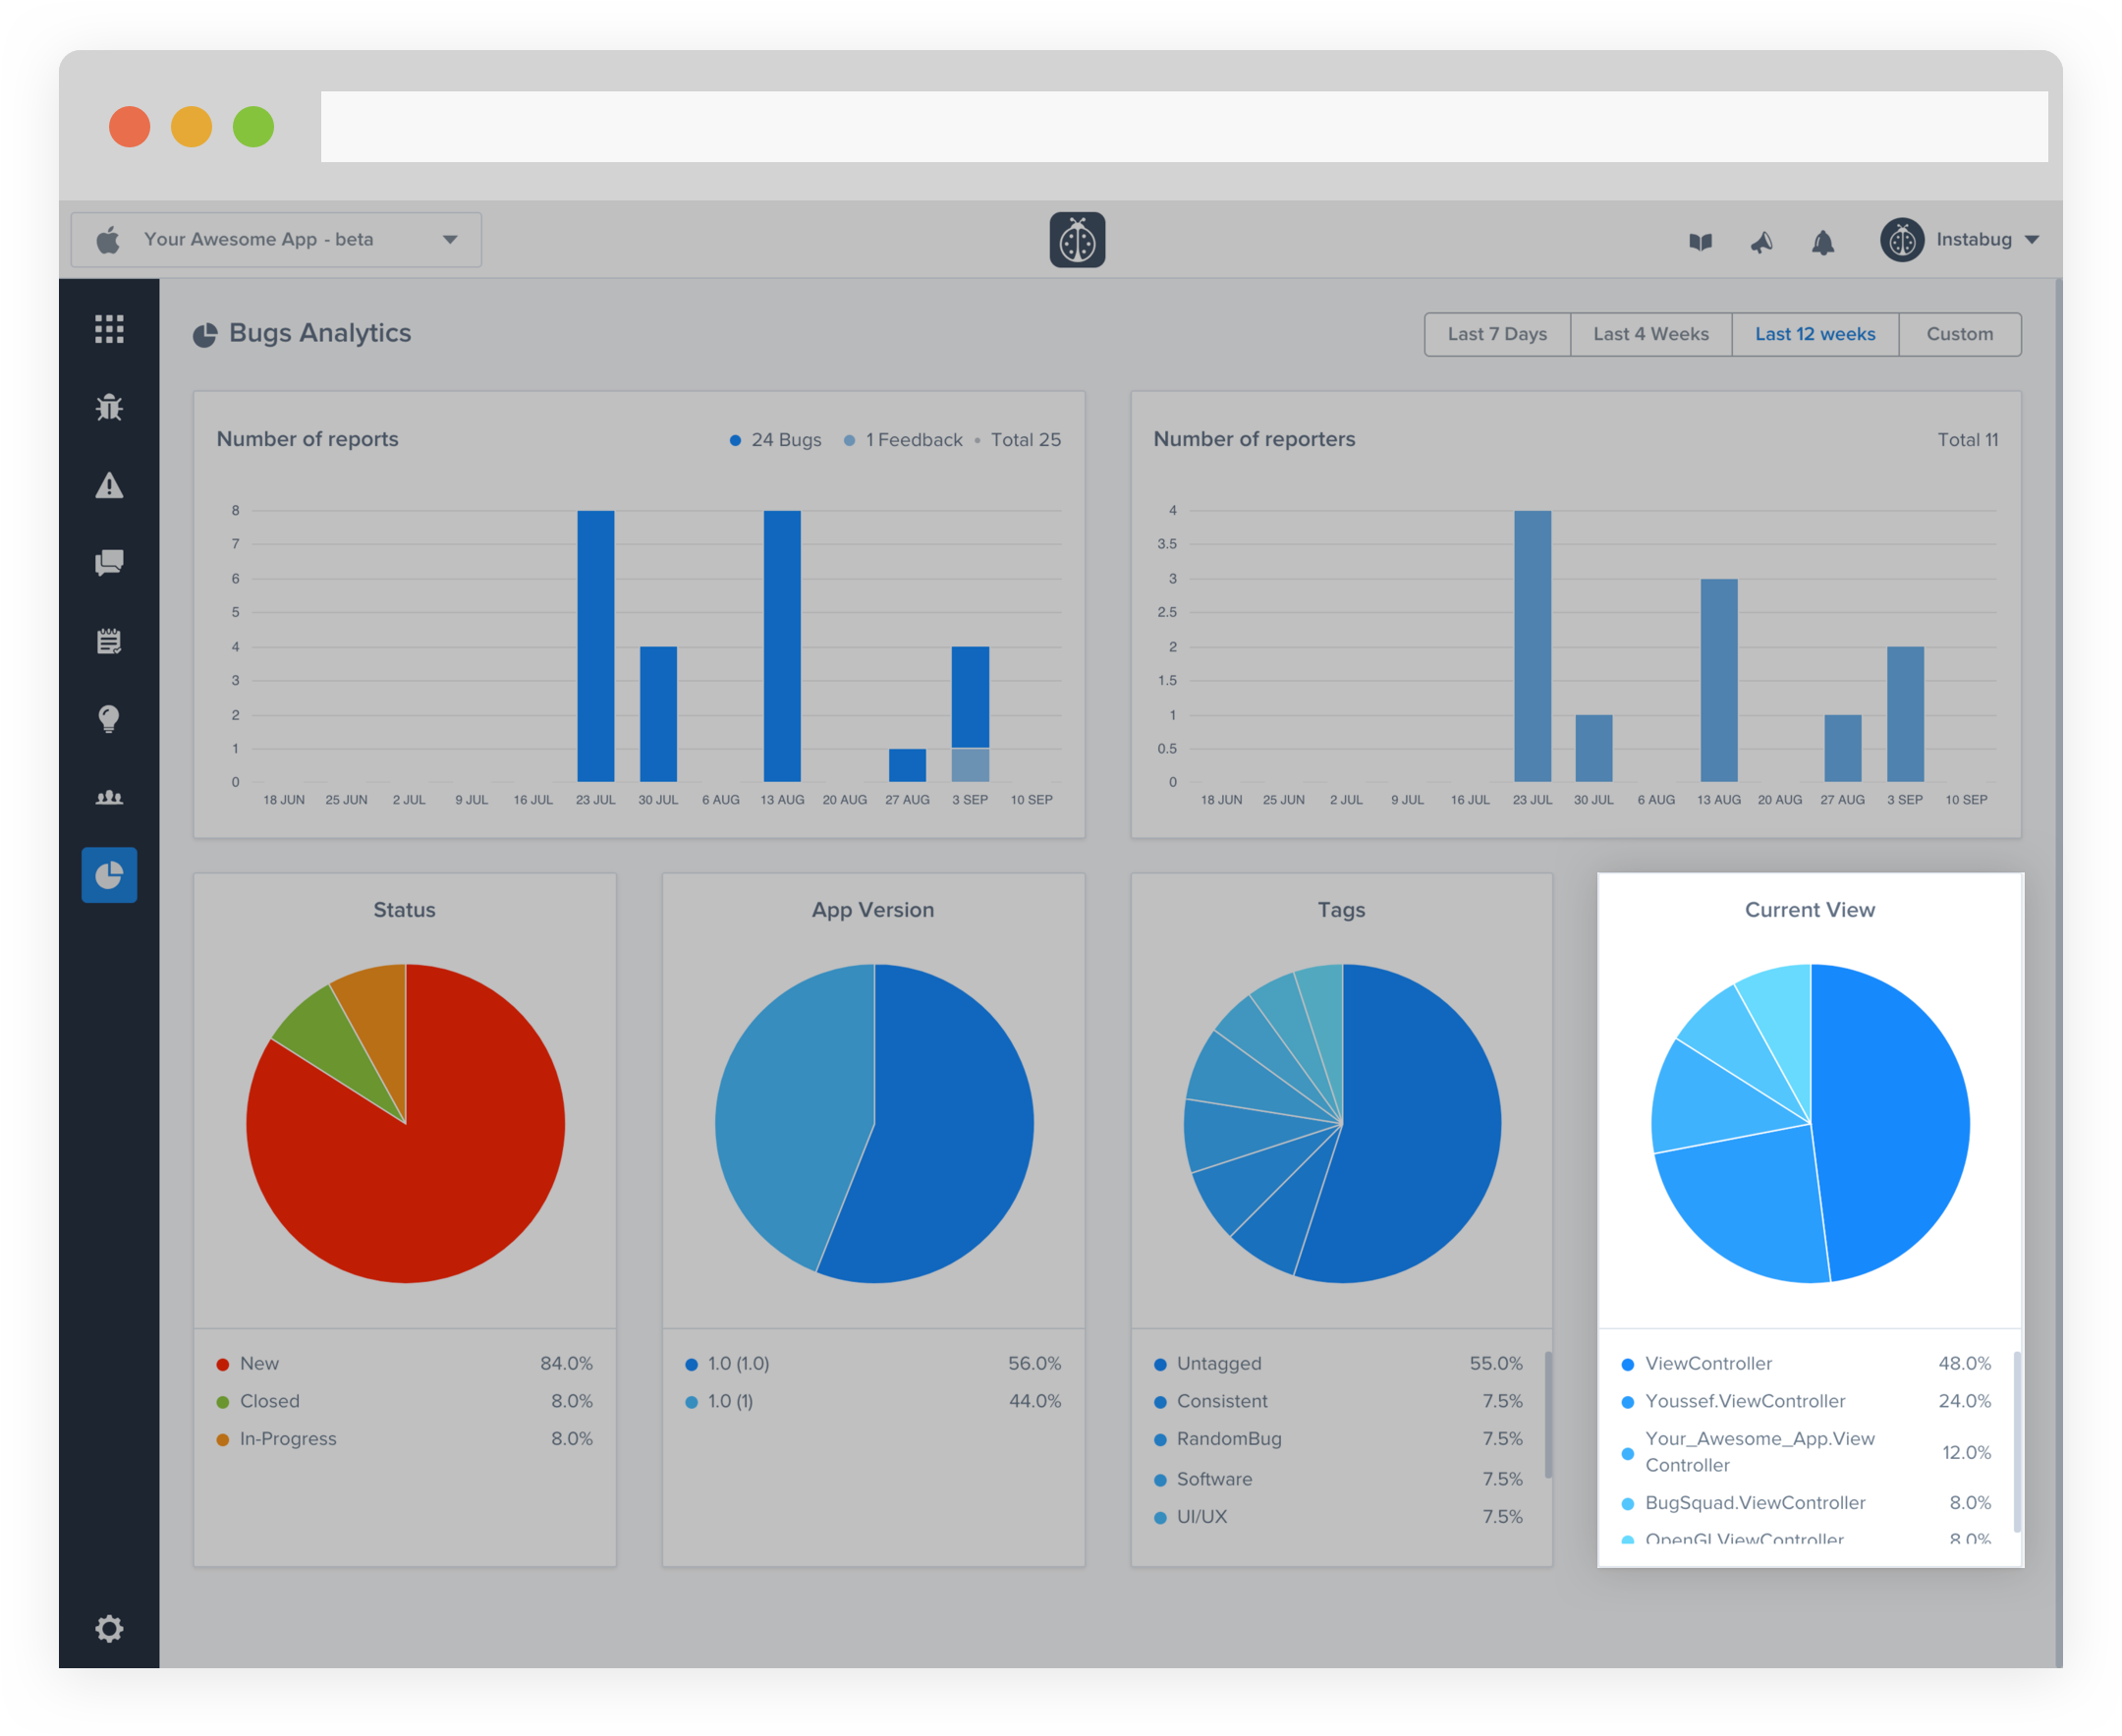
Current View
This pie chart displays a breakdown of the bug reports by current view of the bug report (the view of the app the user was on when the report was sent). The pie chart consists of parts equal to the number of views available within the specified time frame. When hovering over a slice of the pie chart, the specific number of reports that were reported from within that view will be shown.
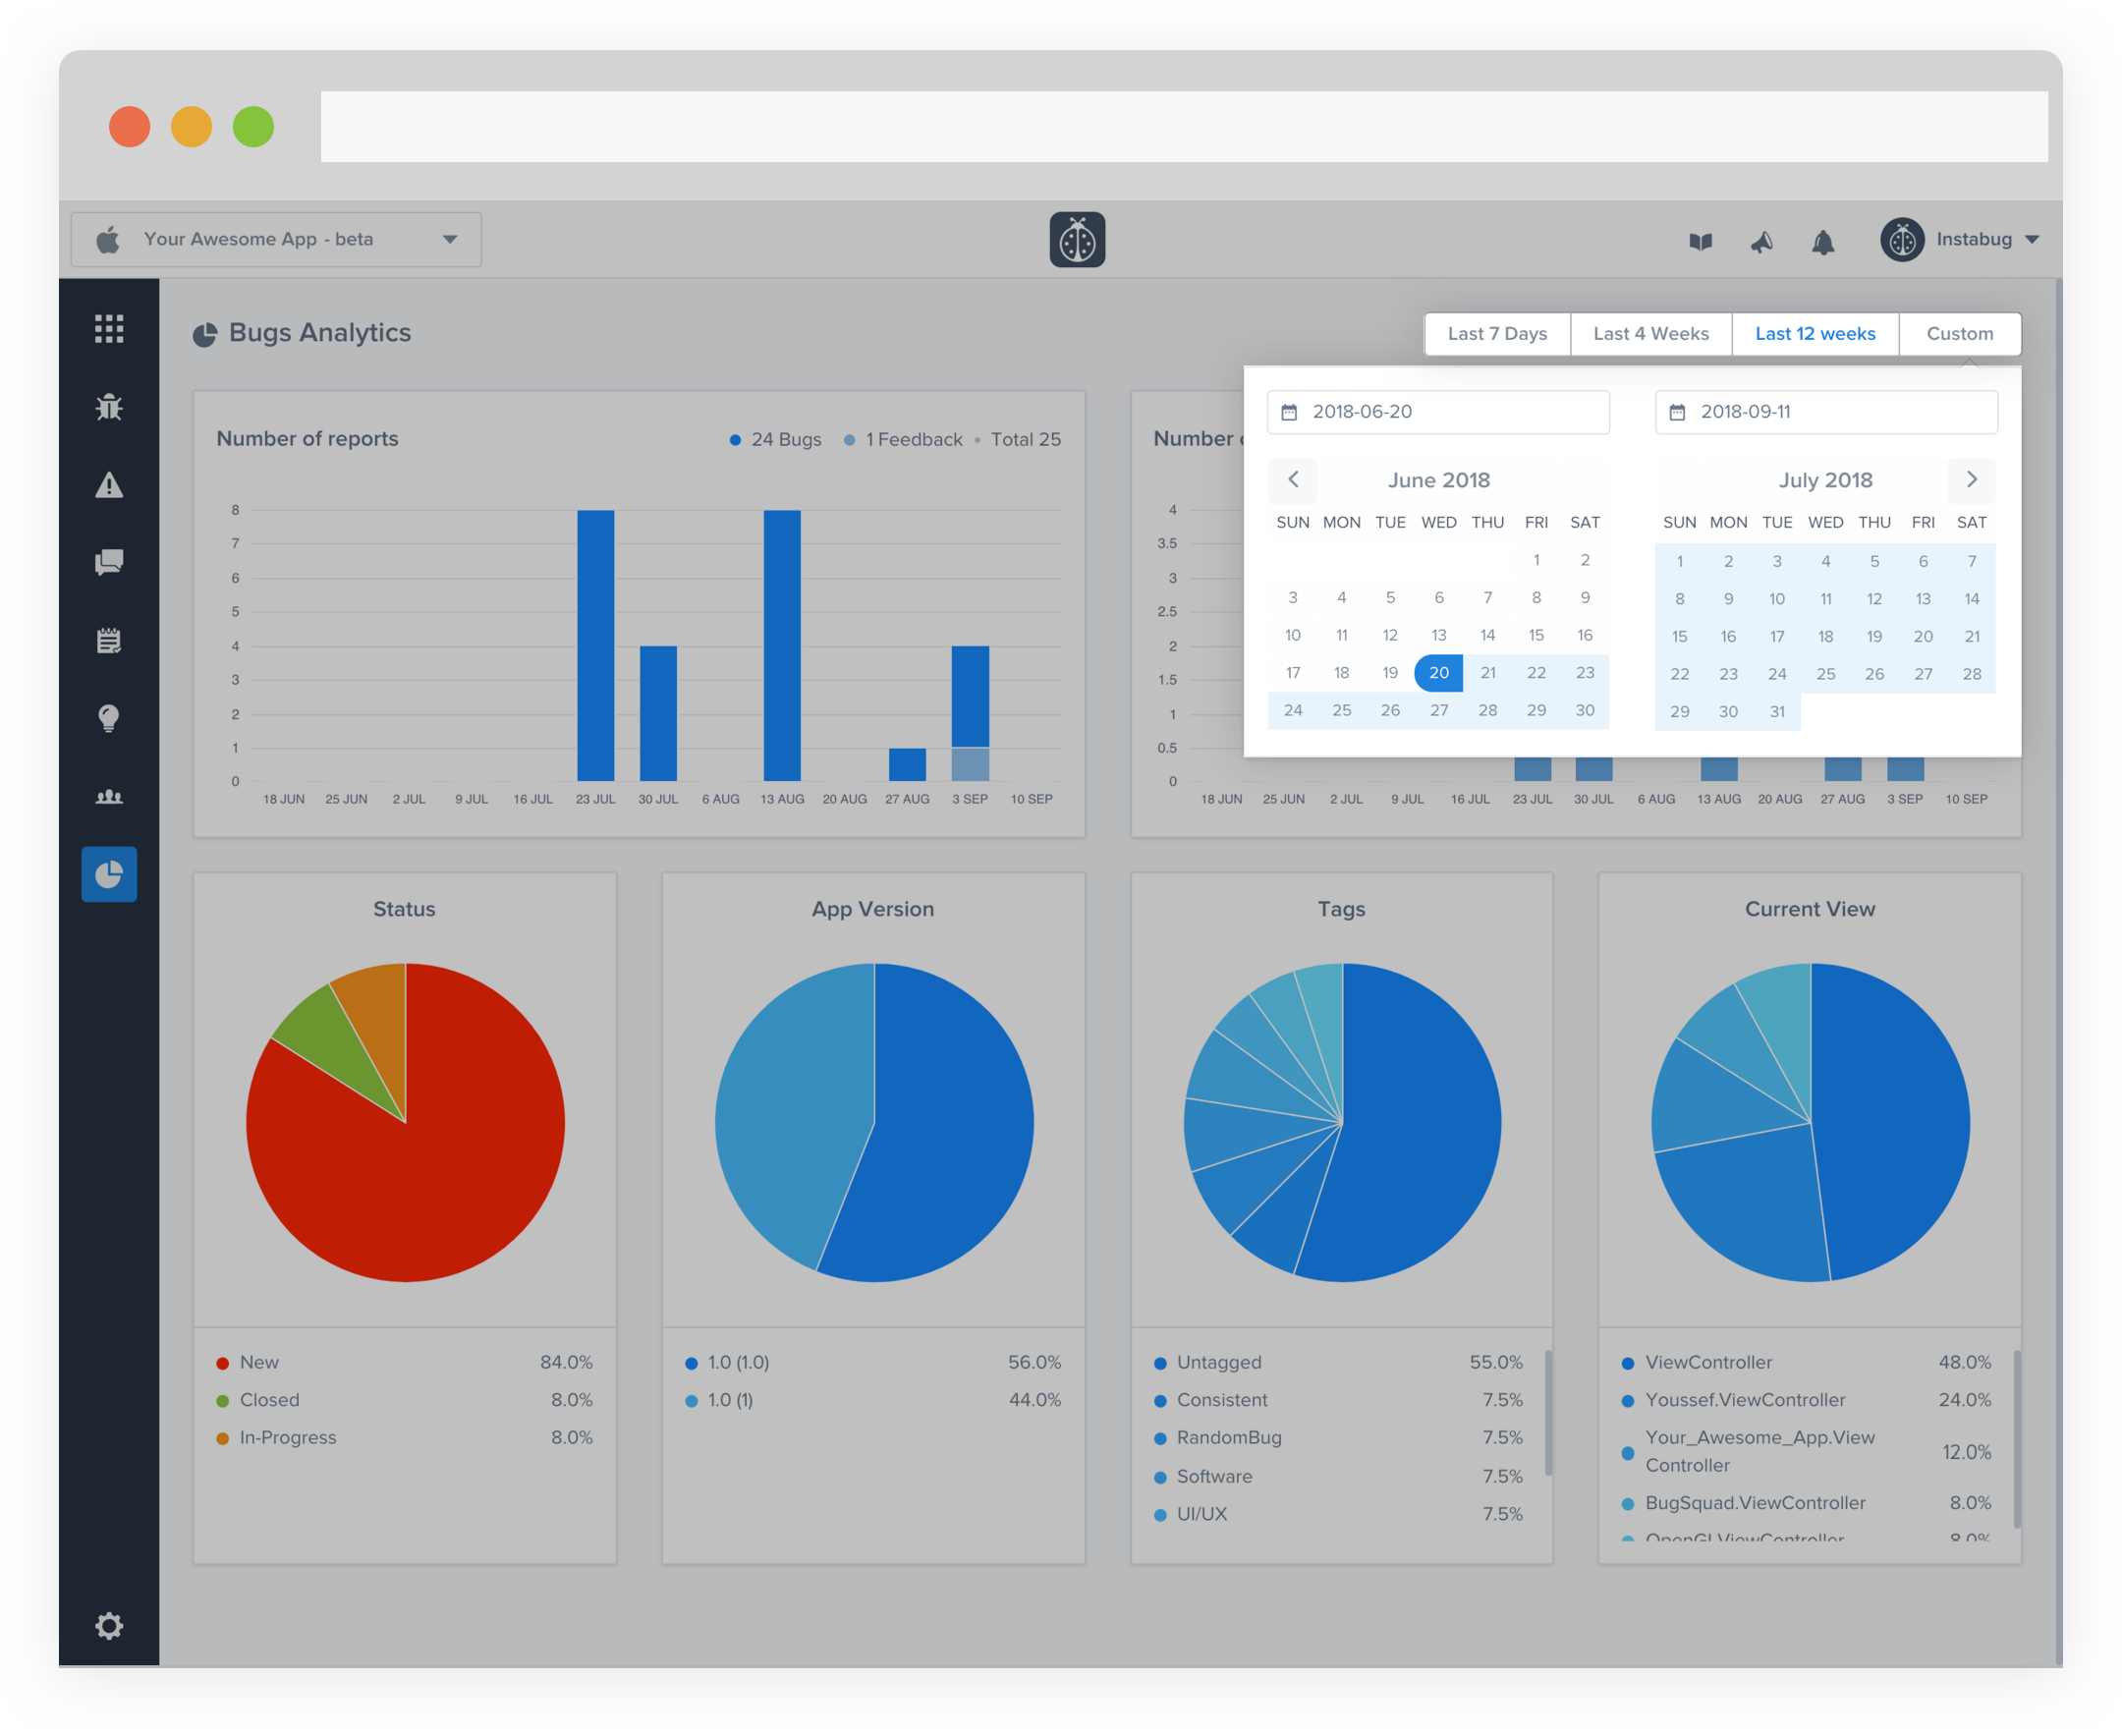
Customizing the Time-frame
You can change the data to show only analytics of reports that were received within a certain time frame. You can use the preexisting options of past week, past 4 weeks, or past 12 weeks. You can also create a custom time frame by choosing the custom option and specifying your date range